
Excelmatic - AI-Powered Excel Data Analysis

Product Introduction

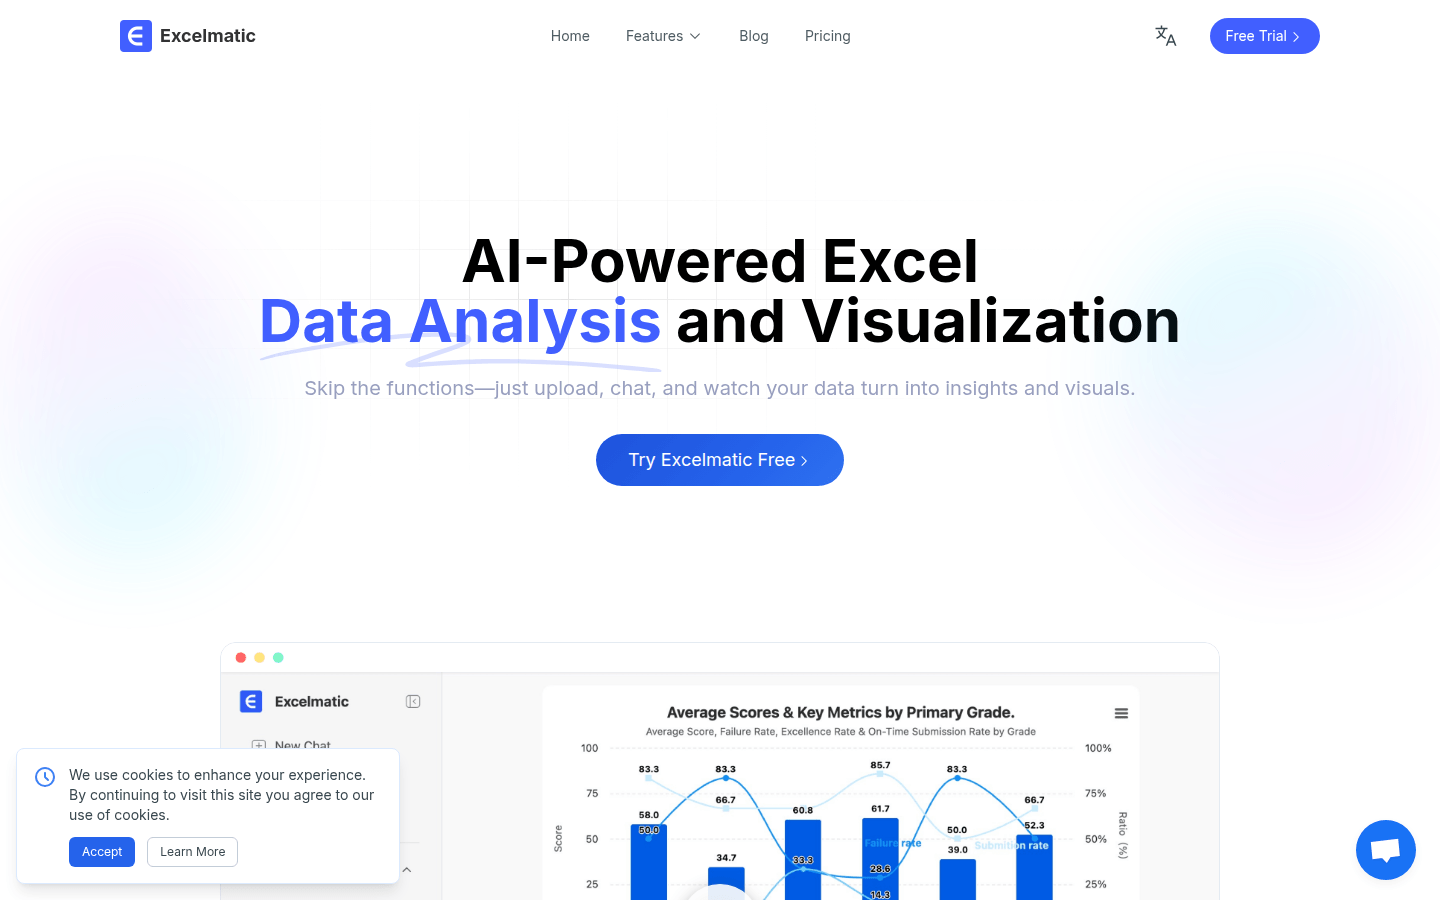
Excelmatic is an innovative AI-powered platform designed to revolutionize how users interact with Excel data. By leveraging natural language processing (NLP), it enables seamless communication with spreadsheet data without requiring advanced formula knowledge. The platform supports xlsx and csv file formats and provides immediate answers, generates visualizations, and delivers AI-powered insights.

Image

Key Features

Automated Data Processing

  • Eliminates manual copy-paste tasks
  • Supports batch processing of multiple tables
  • Allows customizable cleaning rules based on business needs

Intelligent Data Recognition

  • Automatically identifies data types
  • Prevents formatting errors
  • Ensures accurate data processing foundation

Visualization Tools

  • Generates professional charts (bar, pie, line) through conversational interface
  • Recommends optimal chart types based on data characteristics
  • Offers customizable styling options (colors, fonts, labels)
  • Provides auto-refreshing charts for real-time insights

Instant Insights Engine

  • Extracts key performance indicators (KPIs) automatically
  • Supports multi-dimensional analysis capabilities
  • Delivers actionable business intelligence summaries

The platform significantly reduces the time required for data analysis while improving accuracy.

Enjoyed this article?

Subscribe to our newsletter for the latest AI news, product reviews, and project recommendations delivered to your inbox weekly.

Weekly digestFree foreverUnsubscribe anytime

Related Articles

ChartGen AI: Turn Data into Visual Stories Instantly
Products

ChartGen AI: Turn Data into Visual Stories Instantly

ChartGen AI is your smart assistant for transforming raw numbers into compelling visual stories. This free tool lets anyone create professional-grade charts in seconds - no design skills needed. Simply upload your spreadsheet or connect a data source, describe what you want to see, and watch as beautiful bar graphs, pie charts, and heatmaps come to life. Perfect for business reports, marketing analyses, or HR presentations, it handles everything from quarterly financials to customer satisfaction surveys with enterprise-level security.

January 8, 2026
data visualizationAI toolsbusiness intelligence
Yorph AI: Smart Data Platform for Modern Businesses
Products

Yorph AI: Smart Data Platform for Modern Businesses

Yorph AI is revolutionizing how teams work with data by blending no-code simplicity with powerful automation. Designed for everyone from analysts to executives, this platform tears down technical barriers while maintaining robust governance. Imagine transforming raw numbers into actionable insights without waiting for IT—that's the promise Yorph AI delivers. Its self-healing pipelines adapt when source systems change, saving countless hours on manual updates. Whether you're tracking marketing campaigns or optimizing financial reports, Yorph AI puts enterprise-grade data tools at your fingertips.

November 27, 2025
data automationbusiness intelligenceno-code analytics
Chatref: Transform Your Business Knowledge into Smart Conversations
Products

Chatref: Transform Your Business Knowledge into Smart Conversations

Chatref revolutionizes customer interactions by turning your company's knowledge into intelligent chat responses. This no-code platform uses advanced RAG technology to create AI assistants that actually understand your business. Perfect for support teams drowning in scattered information or sales teams needing instant product expertise, Chatref pulls answers directly from your documents, websites, and databases. Set it up in minutes without technical skills - just connect your content sources and let the AI handle customer queries with impressive accuracy. From e-commerce to financial services, any team tired of repeating answers will love how Chatref makes knowledge instantly accessible.

December 29, 2025
AI chatbotno-code platformcustomer support automation
ChartGen.ai: Turn Data into Stunning Visuals Instantly
Products

ChartGen.ai: Turn Data into Stunning Visuals Instantly

ChartGen.ai makes data visualization effortless. Simply describe your chart in plain English, and this AI-powered tool transforms your numbers into professional visuals instantly. Perfect for business reports, academic papers, or social media content, it offers 12 color themes and exports in multiple formats. Best part? You get 50 free charts monthly—no credit card required. Whether you're analyzing sales trends or presenting research findings, ChartGen helps your data tell compelling stories visually.

December 18, 2025
data visualizationAI toolsbusiness analytics
BigIdeasDB: Your AI-Powered Product Development Sidekick
Products

BigIdeasDB: Your AI-Powered Product Development Sidekick

BigIdeasDB is like having a savvy business partner who never sleeps. This AI-powered toolkit helps entrepreneurs and product developers spot golden opportunities hidden in mountains of market data. Whether you're analyzing app store complaints, tracking Reddit discussions, or validating product ideas before writing code, BigIdeasDB turns chaotic information into clear action plans. It's particularly handy for startups looking to avoid costly mistakes by understanding real user pain points upfront. The platform even helps translate rough ideas into development roadmaps - perfect for when you know what problem to solve but aren't sure how to build it.

December 5, 2025
AI product developmentmarket researchstartup tools
Estimatic AI: Smart Analytics for Business Growth
Products

Estimatic AI: Smart Analytics for Business Growth

Estimatic AI is a powerful business analytics tool that helps companies understand customer behavior through smart cookie tracking and data analysis. It offers personalized content recommendations, detailed traffic insights, and collaboration with social media platforms—all while respecting user privacy controls. Perfect for e-commerce sites, media platforms, and online educators looking to boost engagement and conversions.

November 10, 2025
business analyticscustomer insightsdata visualization